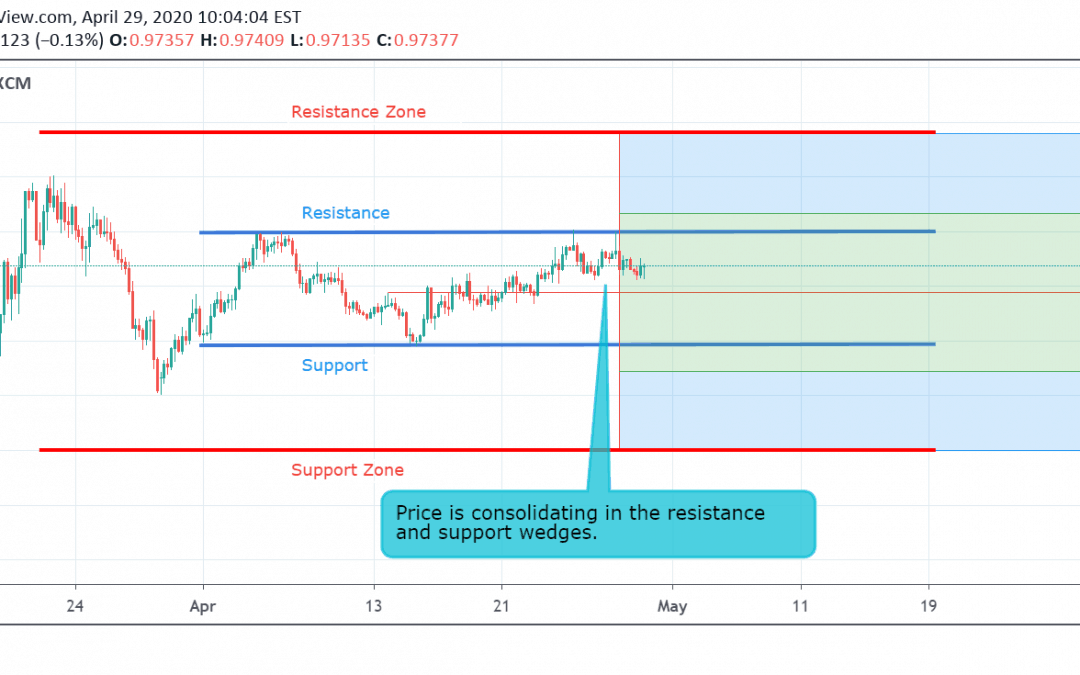
by Rishikesh Lilawat | Apr 29, 2020 | Forex Trade Ideas, USDCHF
Currently, USD/CHF is trading at 0.9737. The pair started a sideways trend on 7 April and now the price is consolidating in the resistance and support wedges . If the price breaks the resistance level at 0.9799, then it may touch its resistance zone at 0.9978....
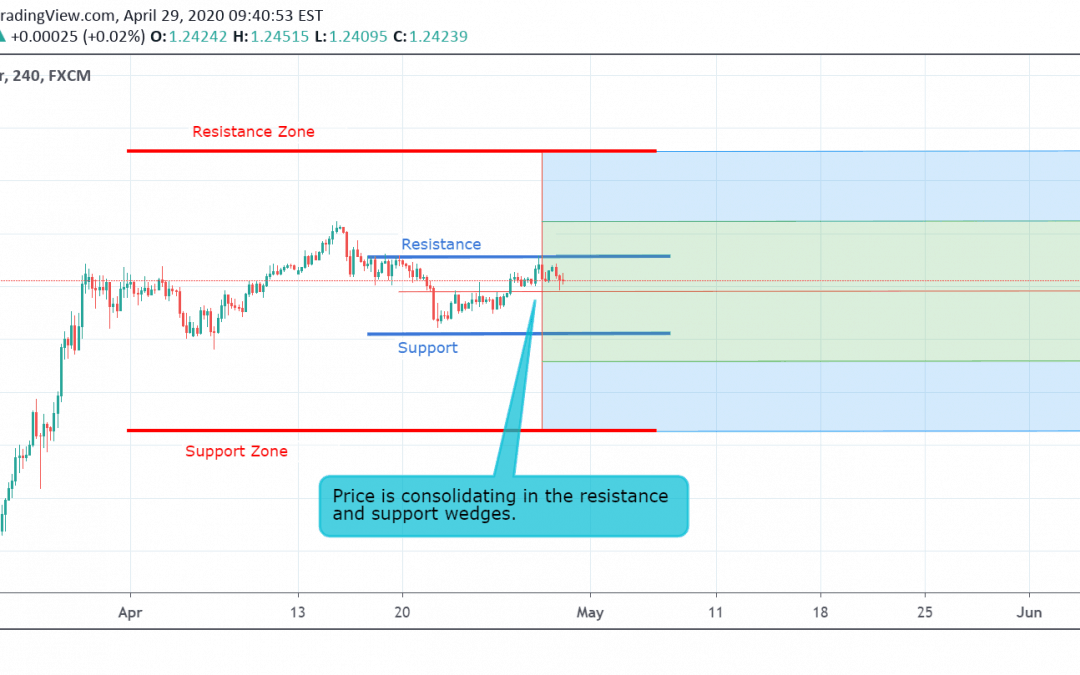
by Rishikesh Lilawat | Apr 29, 2020 | Forex Trade Ideas, GBPUSD
Currently, GBP/USD is trading at 1.2425. The pair started a sideways trend on 17 April and now the price is consolidating in the resistance and support wedges. If the price breaks the resistance level at 1.2512, then it may touch its resistance zone at 1.2909....
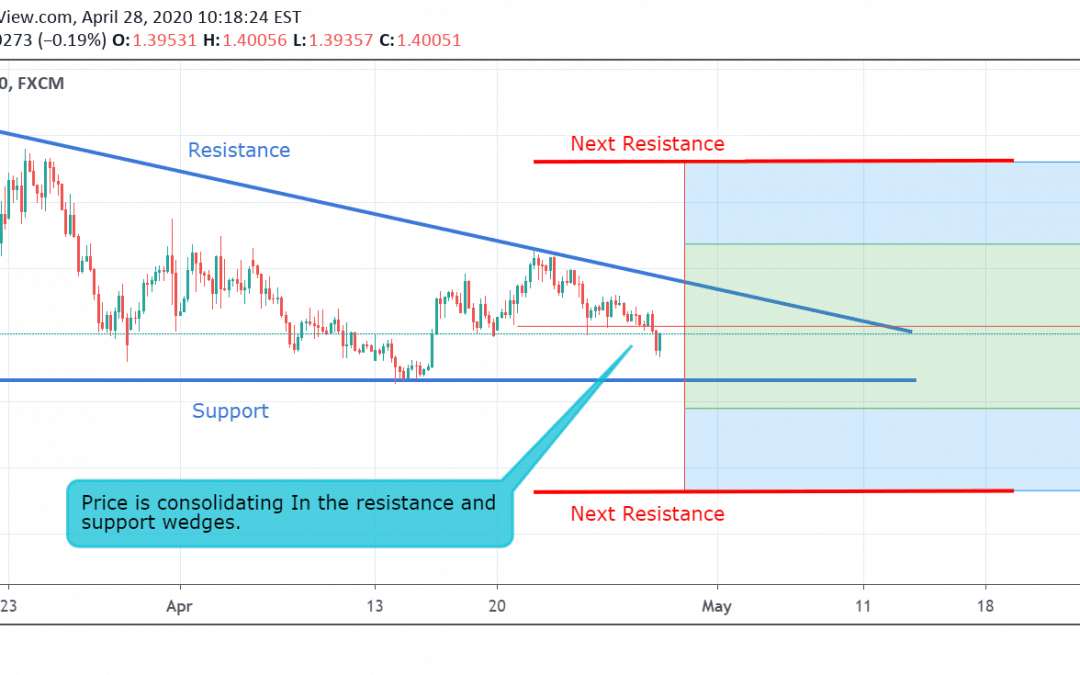
by Rishikesh Lilawat | Apr 28, 2020 | Forex Trade Ideas, USDCAD
Currently, USD/CAD is trading at 1.4004. The pair started a sideways trend on 21 April and now the price is consolidating in the resistance and support wedges . If the price breaks the resistance level at 1.4124, then it may touch its next resistance level at 1.4525....
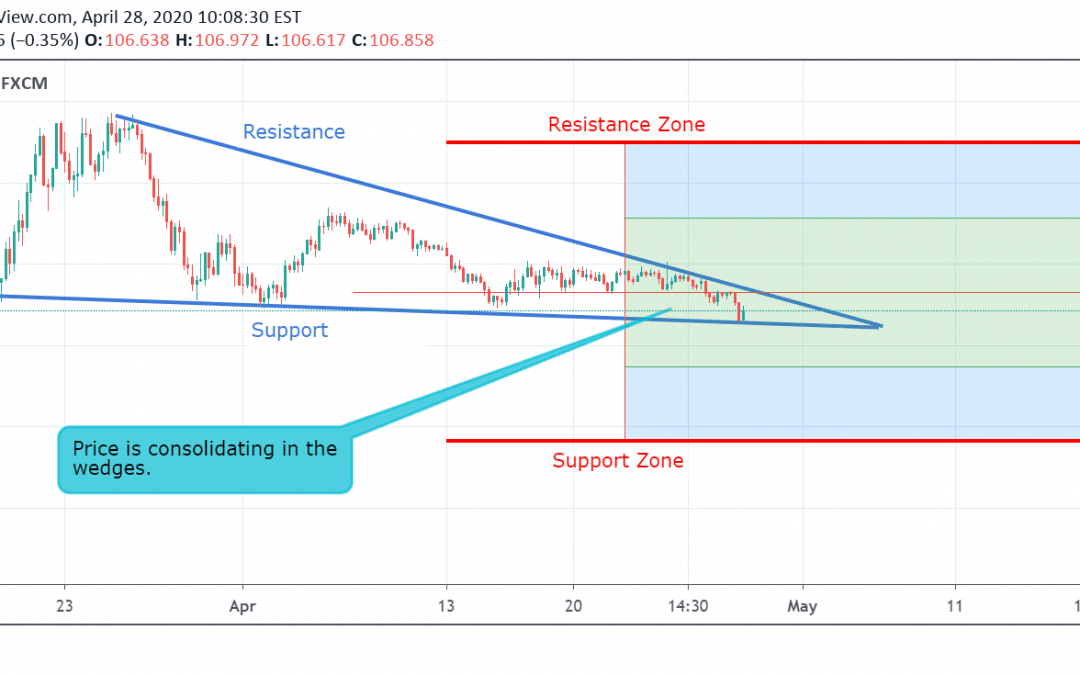
by Rishikesh Lilawat | Apr 28, 2020 | Forex Trade Ideas, USDJPY
Currently, USD/JPY is trading at 106.87. The pair started a sideways trend on 17 April and now the price is consolidating in the descending triangle wedges . If the price breaks the resistance level at 107.93, then it may touch its resistance zone at 111.00. Although,...
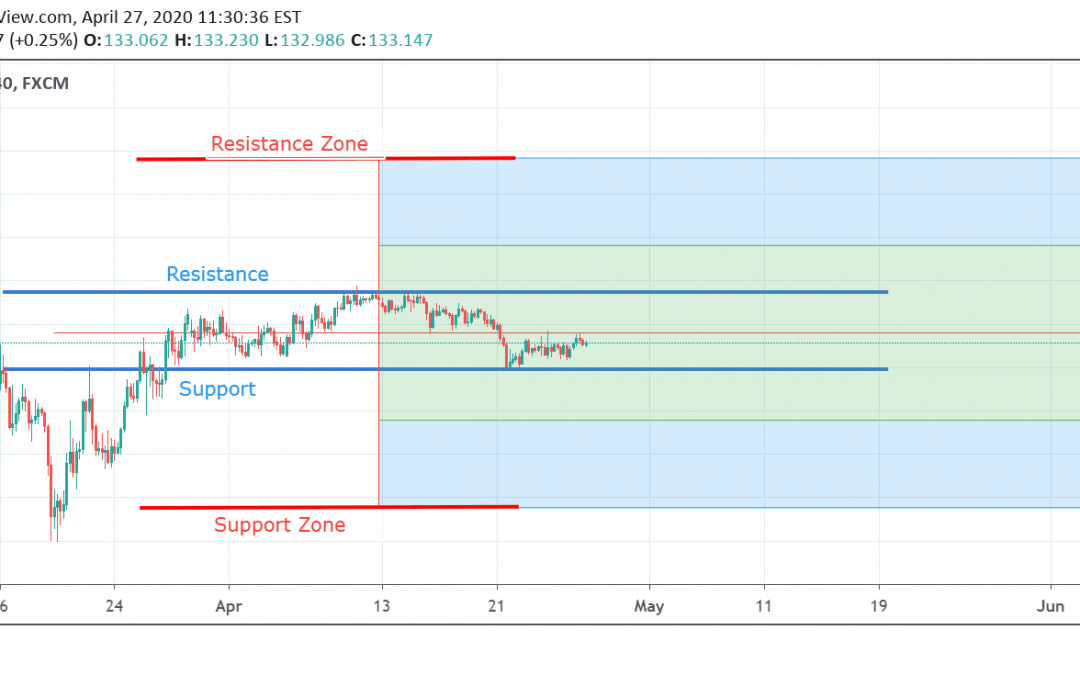
by Rishikesh Lilawat | Apr 27, 2020 | Forex Trade Ideas, GBPJPY
Currently, GBP/JPY is trading at 133.15. The pair started a sideways trend on 12 April after rebounding from the resistance level and now the price is consolidating in the resistance and support wedges . If the price breaks the resistance level at 135.45, then it may...
 ANALYSIS ON USDCADJuly 30, 2020
 AUD/JPY Technical Analysis.July 30, 2020
 EURJPY At Breakout Point Of Pattern.July 30, 2020
 GBPUSD HIT RESISTANCE IN ASCENDING TRIAN…July 28, 2020
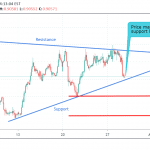 EUR/GBP Technical Analysis.July 28, 2020
 BREAKOUT FROM ASCENDING TRIANGLE IN NZDU…July 27, 2020
 CRUCIAL POINT FOR EURUSDJuly 27, 2020
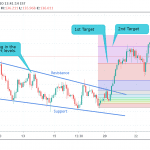 GBP/JPY Technical Analysis.July 23, 2020